 River Check
Using River Check After Rain
Follow the peak, watch how the river falls, check the forecast and compare your options. A practical look at using River Check after rain, with a preview of the recovery model in development.
We all enjoy those settled spells when we barely need to check the forecast. We know what our favourite rivers are doing and, with a bit of luck, we can just pick a spot and go fishing. Then a front moves through, the rivers come up, and the question becomes how long until the rivers are fishable again?
Unfortunately there is no easy answer. An angler with decades of experience of their local river might have a good sense for this, but for the rest of us, it is little more than a guess. Every high-flow event is different, and rivers don’t all recover at the same rate so we are left with one verdict – give it a few days, maybe a week. What if we could take some of the guesswork out of predicting when a river will come right after a fresh? Let’s take a look at how River Check can do just that.
The Peak
Fresh Watch is a useful place to start. Set a watch for a gauge you’re interested in and River Check can let you know when a peak has been detected after a rainfall event. You can receive a notification on the website or by email. The Explore page will show time since the last peak for all rivers, even those not on your Fresh Watch list.
 A Fresh Watch alert tells you when a watched gauge has peaked.
What does the flow history tell us
Taking a look at a river gauge detail page will show the last 7 days of flow history. At a glance you can see the high flow event in context. This tells us how much the flow increased compared to its settled baseline and, after the event has passed, how quickly it is recovering.
Let’s look at a couple of examples.
In the first example, the peak and return to baseline happened quite quickly. This is indicative of a relatively stable catchment and a fast moving front.
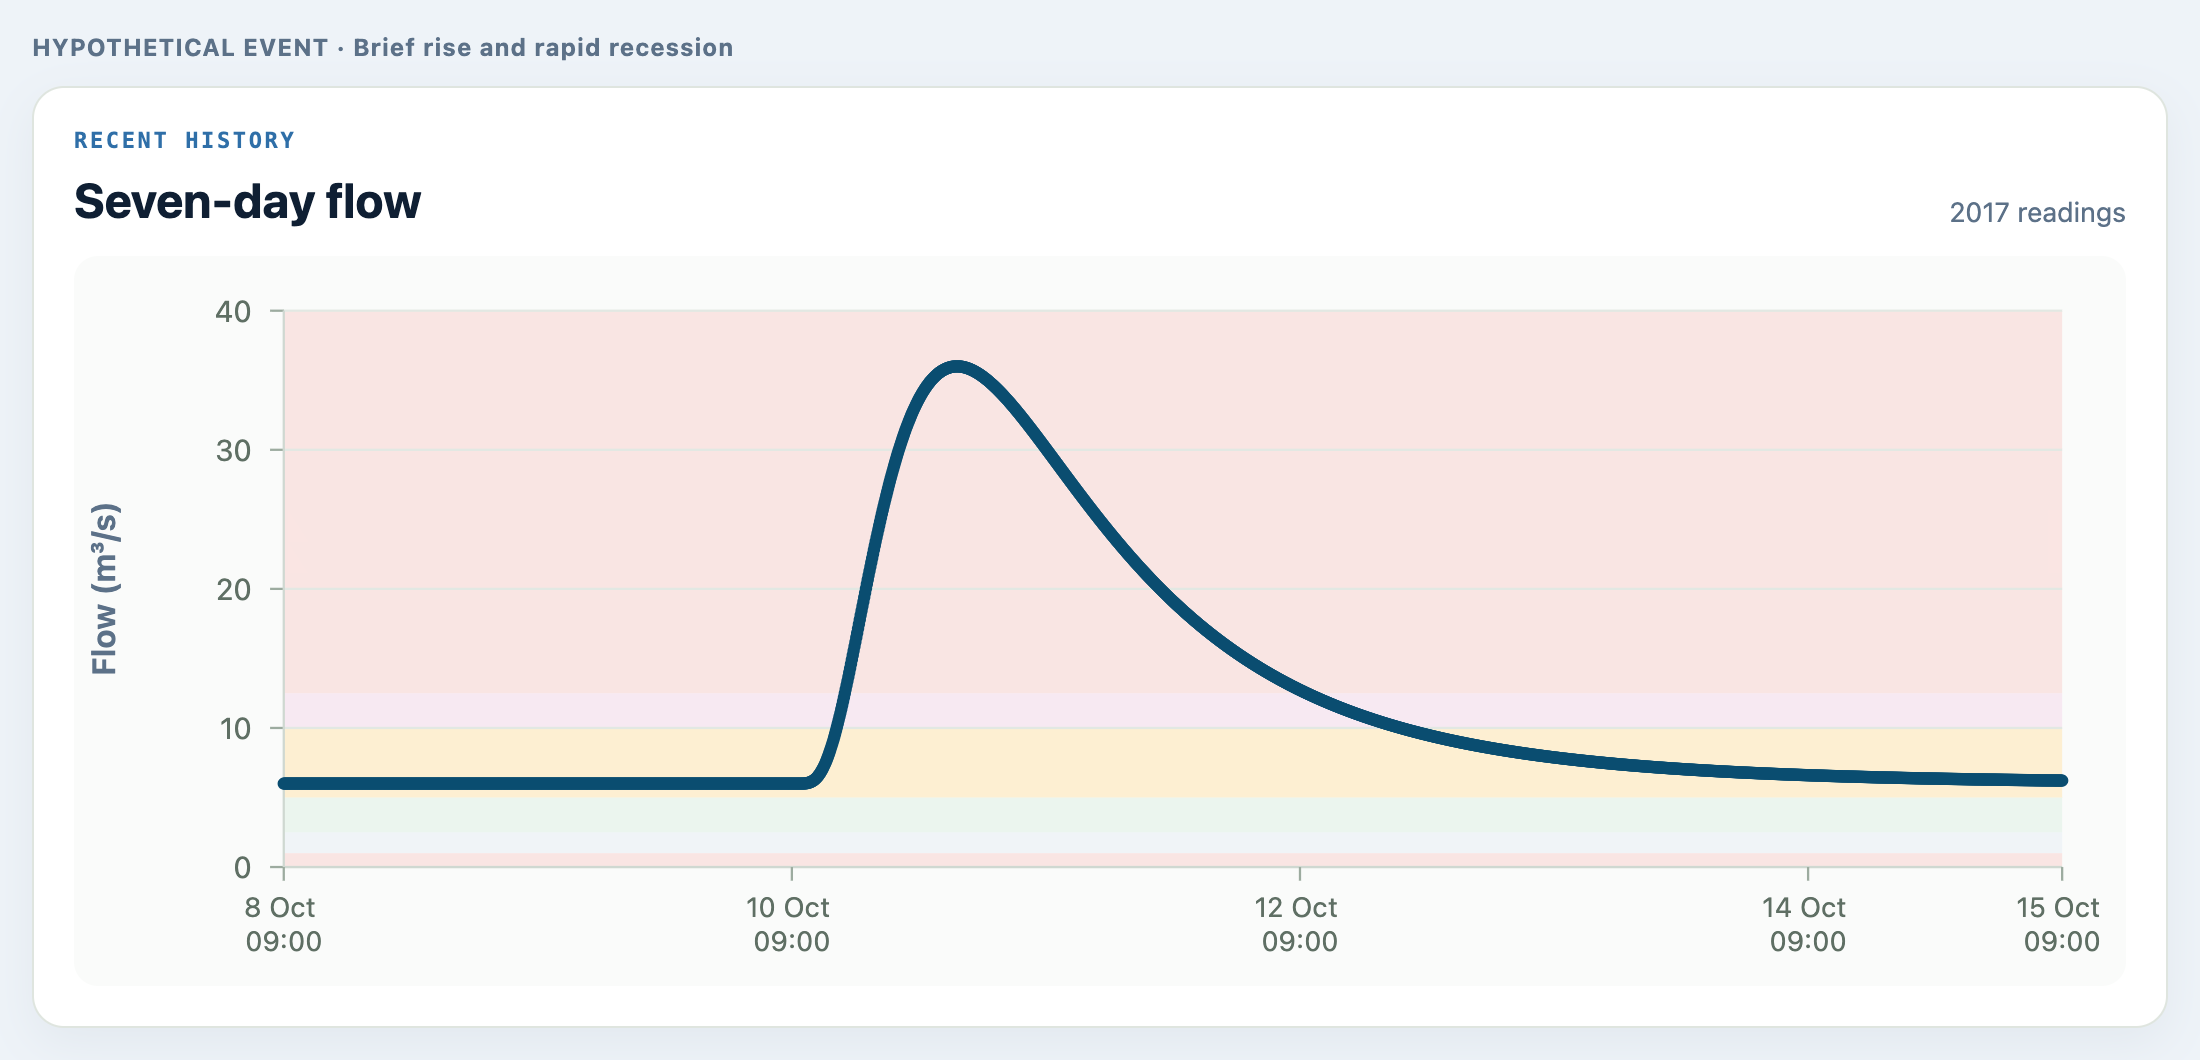 Example 1 · A hypothetical short, sharp event, rising from about 6 to 36 m³/s before dropping quickly towards its earlier flow.
However, if a catchment has experienced quite a lot of recent rain or snowmelt, flow may increase over a longer period and recover more slowly as depicted in the following example.
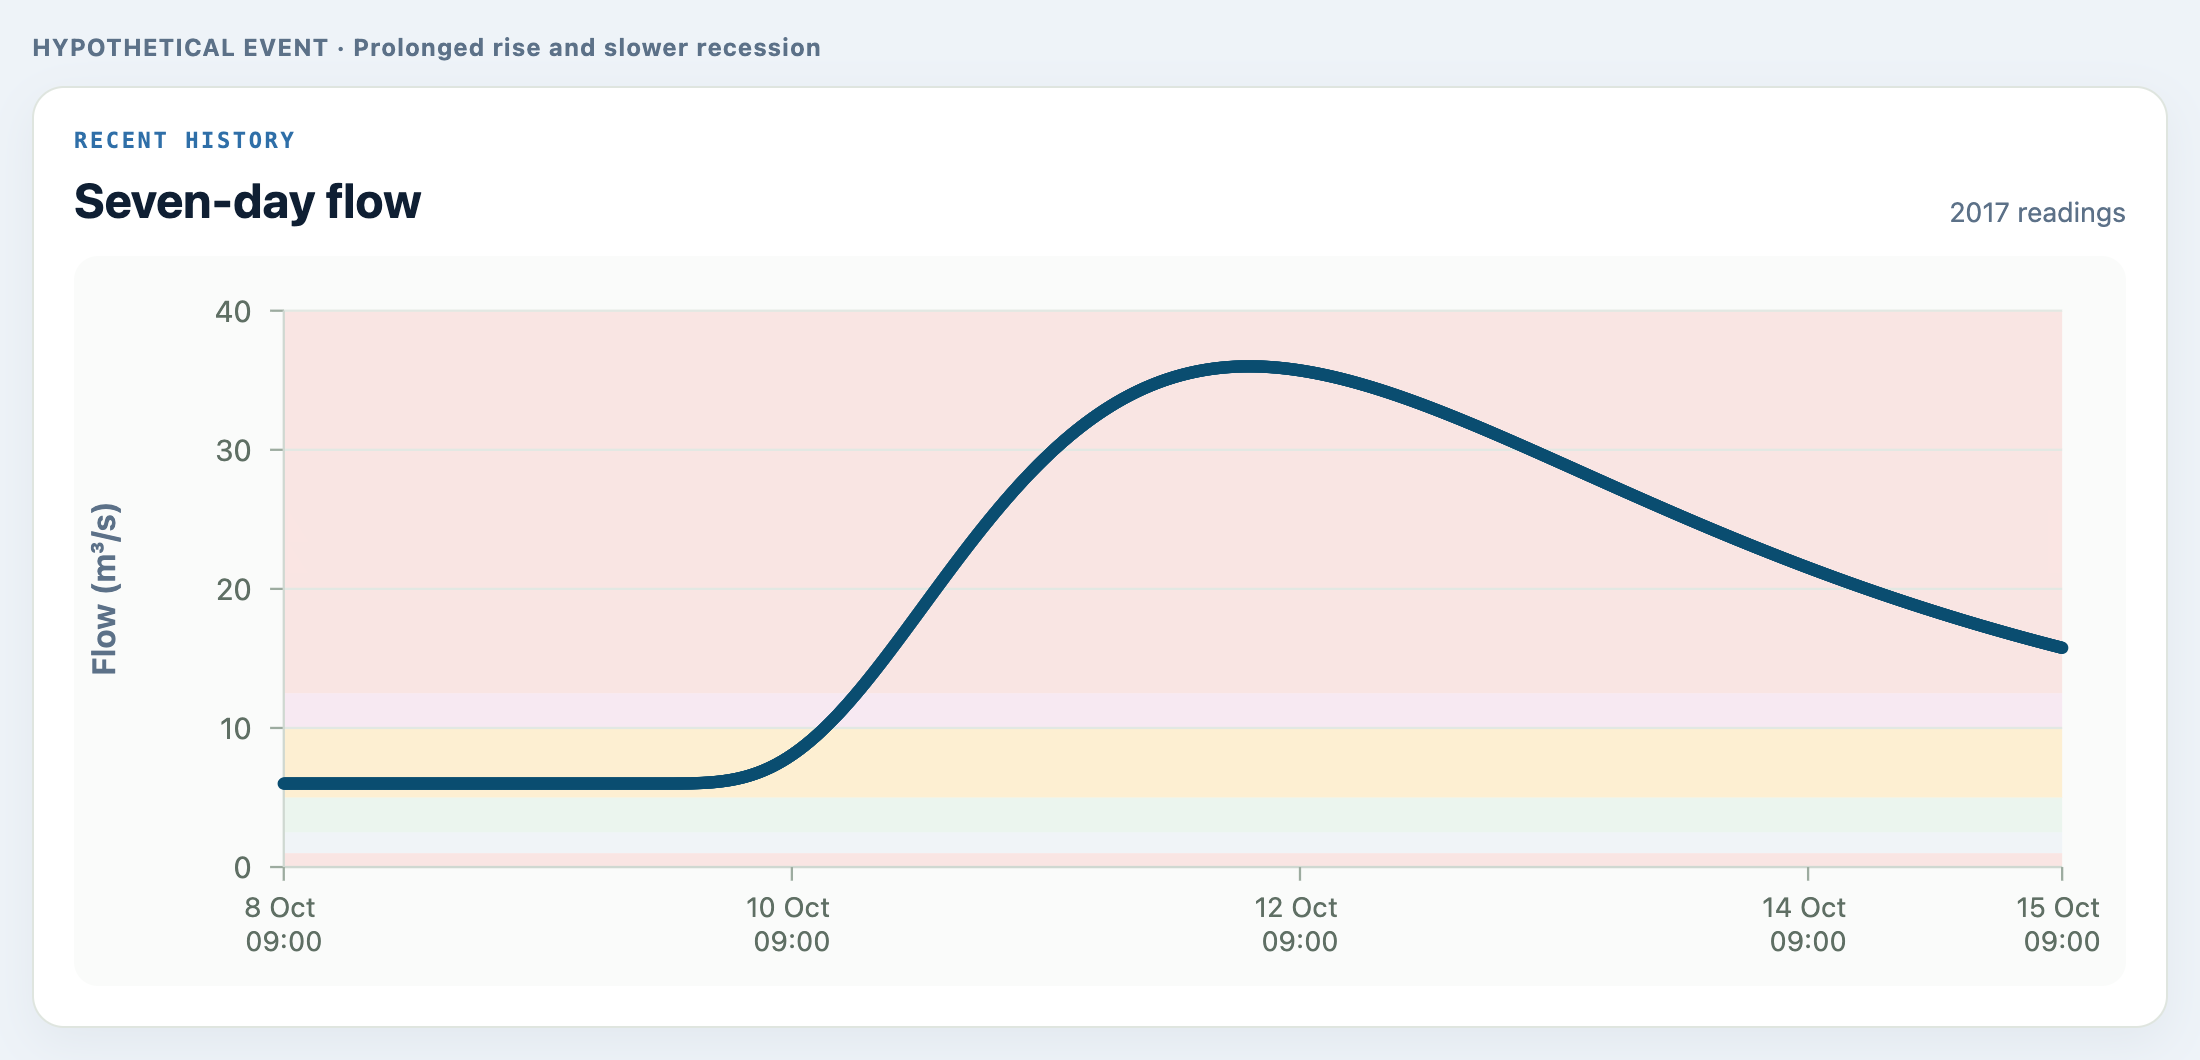 Example 2 · A hypothetical longer event with a slower recession. Both charts use the same scale and flow bands.
These are quite different prospects if you’re hoping to fish in the next day or two. In the first example I’d be checking again soon. In the second, I’d be keeping an eye on it while looking at other options.
Of course, flow is only part of the story. Some rivers clear quickly after a fresh; others can carry colour for days. The chart won’t tell us the clarity, and we can’t read rainfall totals or ground saturation from the shape alone. But knowing how a particular river usually behaves gives us something useful to work with. So what next?
Look across the catchment
It’s worth opening the river system as well as the individual gauge. The headwaters may be dropping while tributaries are still bringing water into the lower river. A reading from one part of the system won’t always describe the reach you want to fish. The following system page shows how the fresh is moving through the system with the downstream beats likely to take much longer to recover than the headwaters.
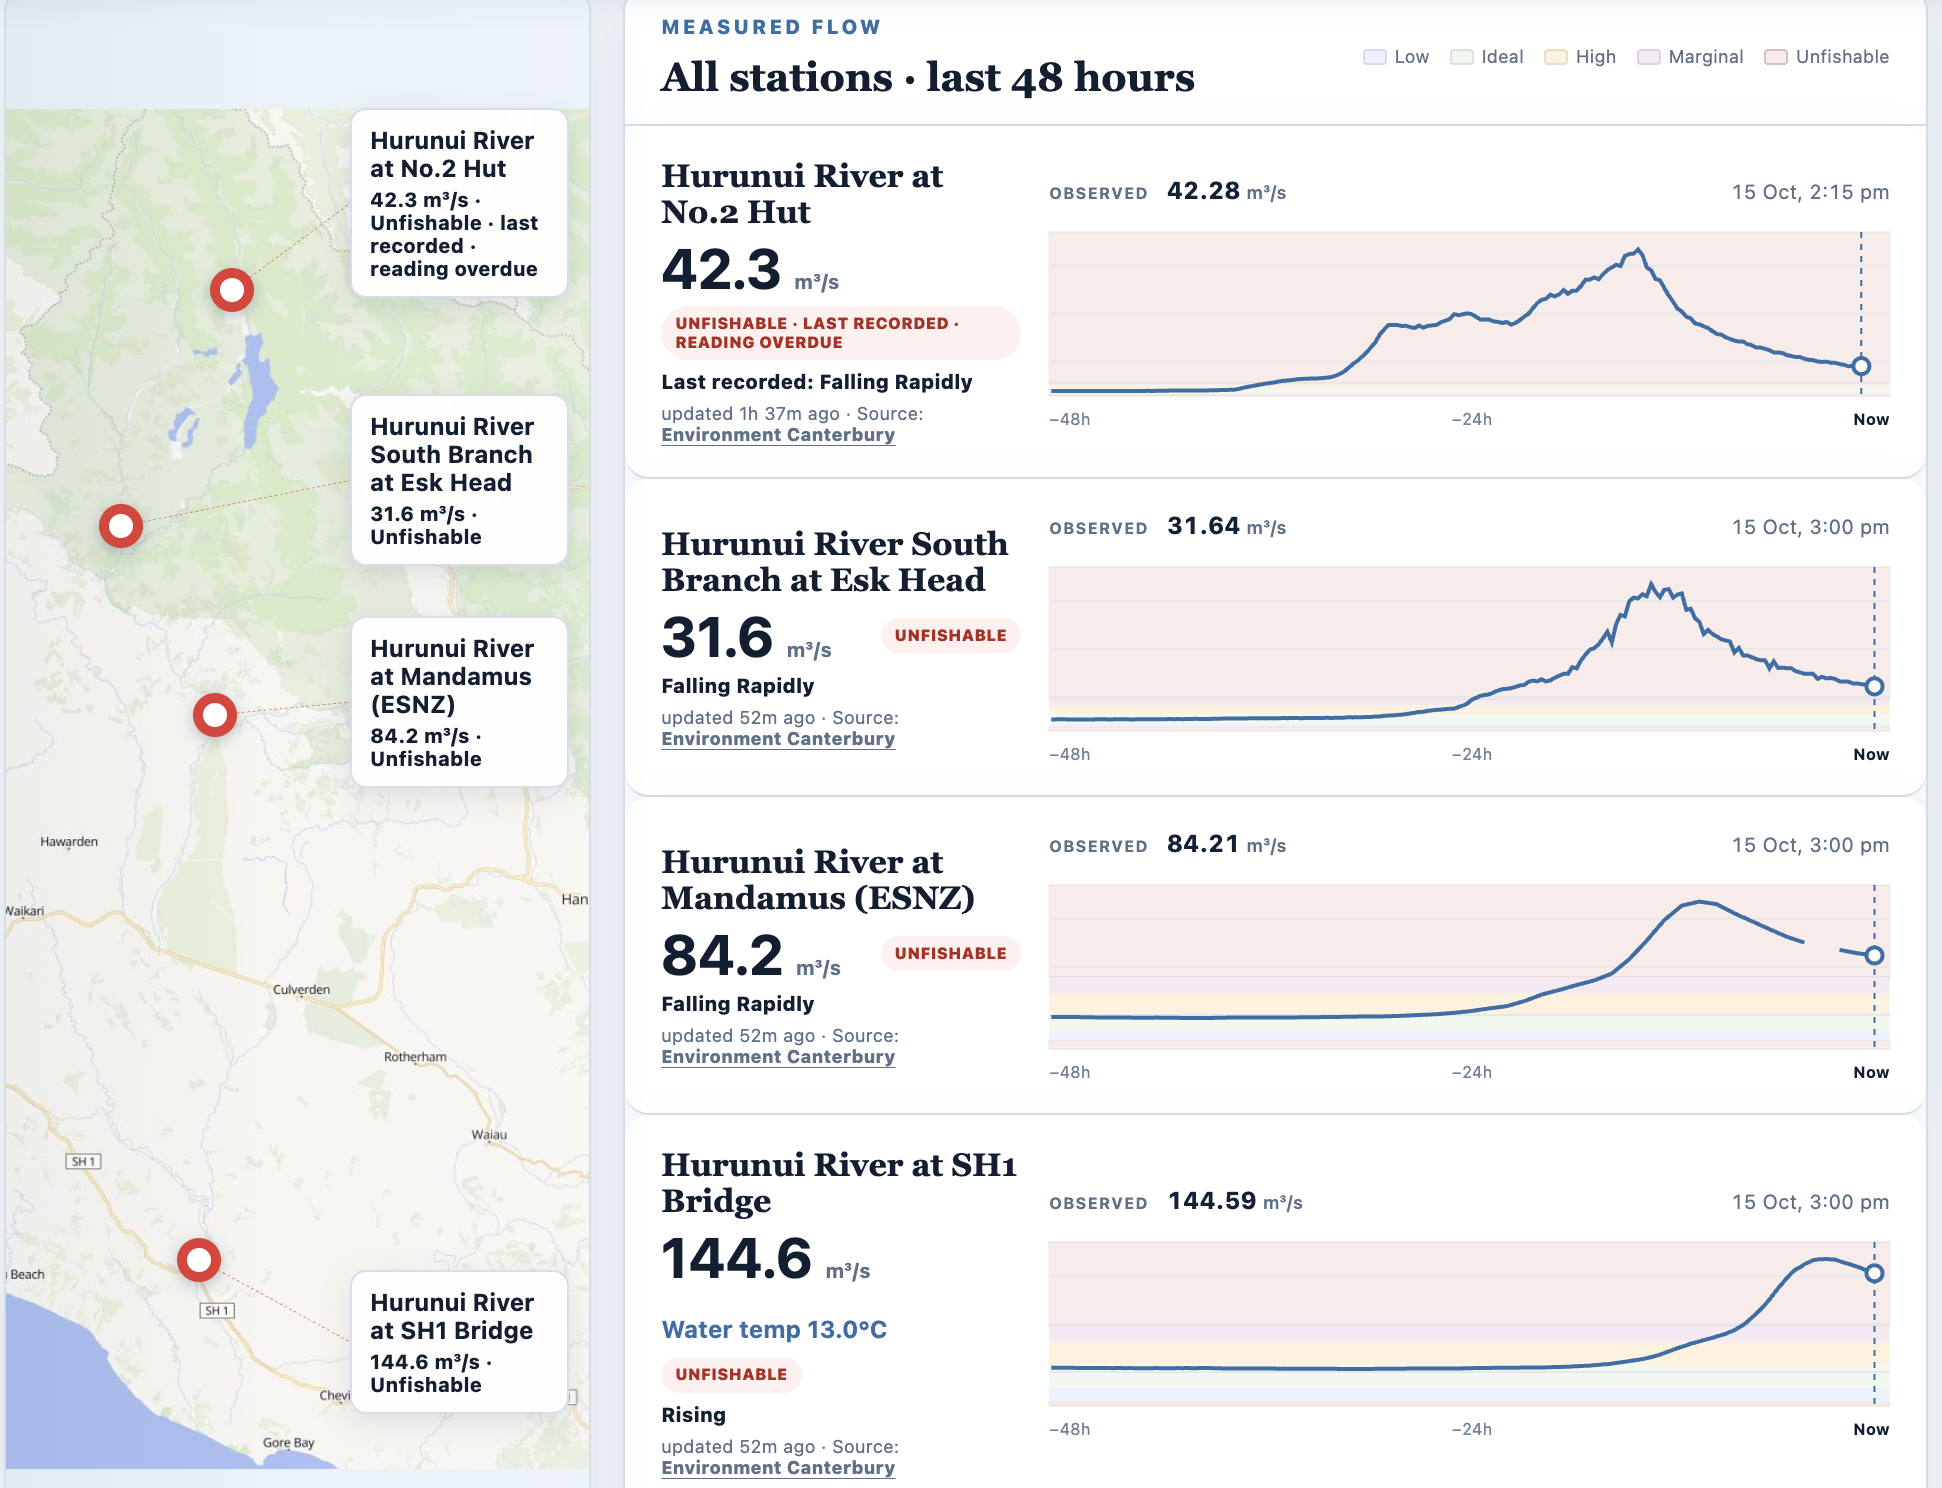 Examine the system · The high flow event can be seen making its way through the catchment.
Then have another look at the weather. Is there more rain coming into the catchment? What’s the wind doing on the day you want to go? Check when the gauge last updated too, especially if conditions are changing quickly.
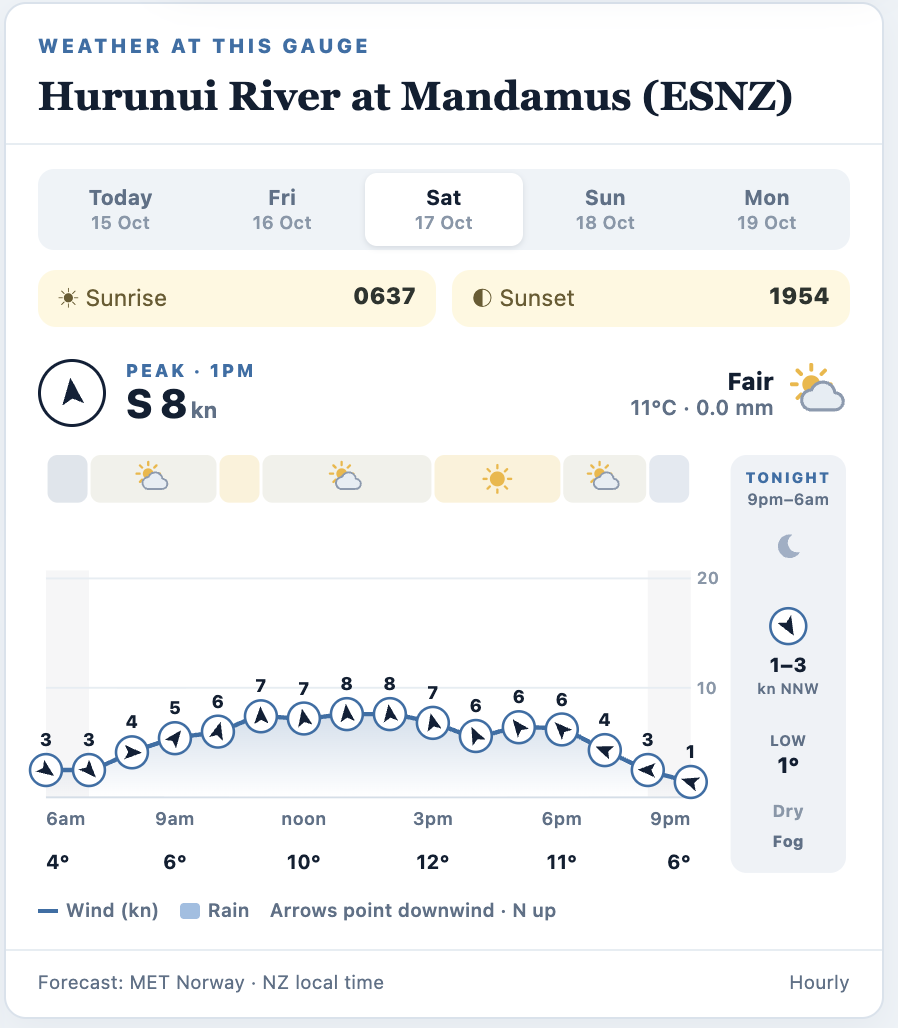 Check the weather · A cold southerly on the weekend marks a change to more settled conditions.
Then I take a look at the forecast charts to see the general weather pattern over the next few days.
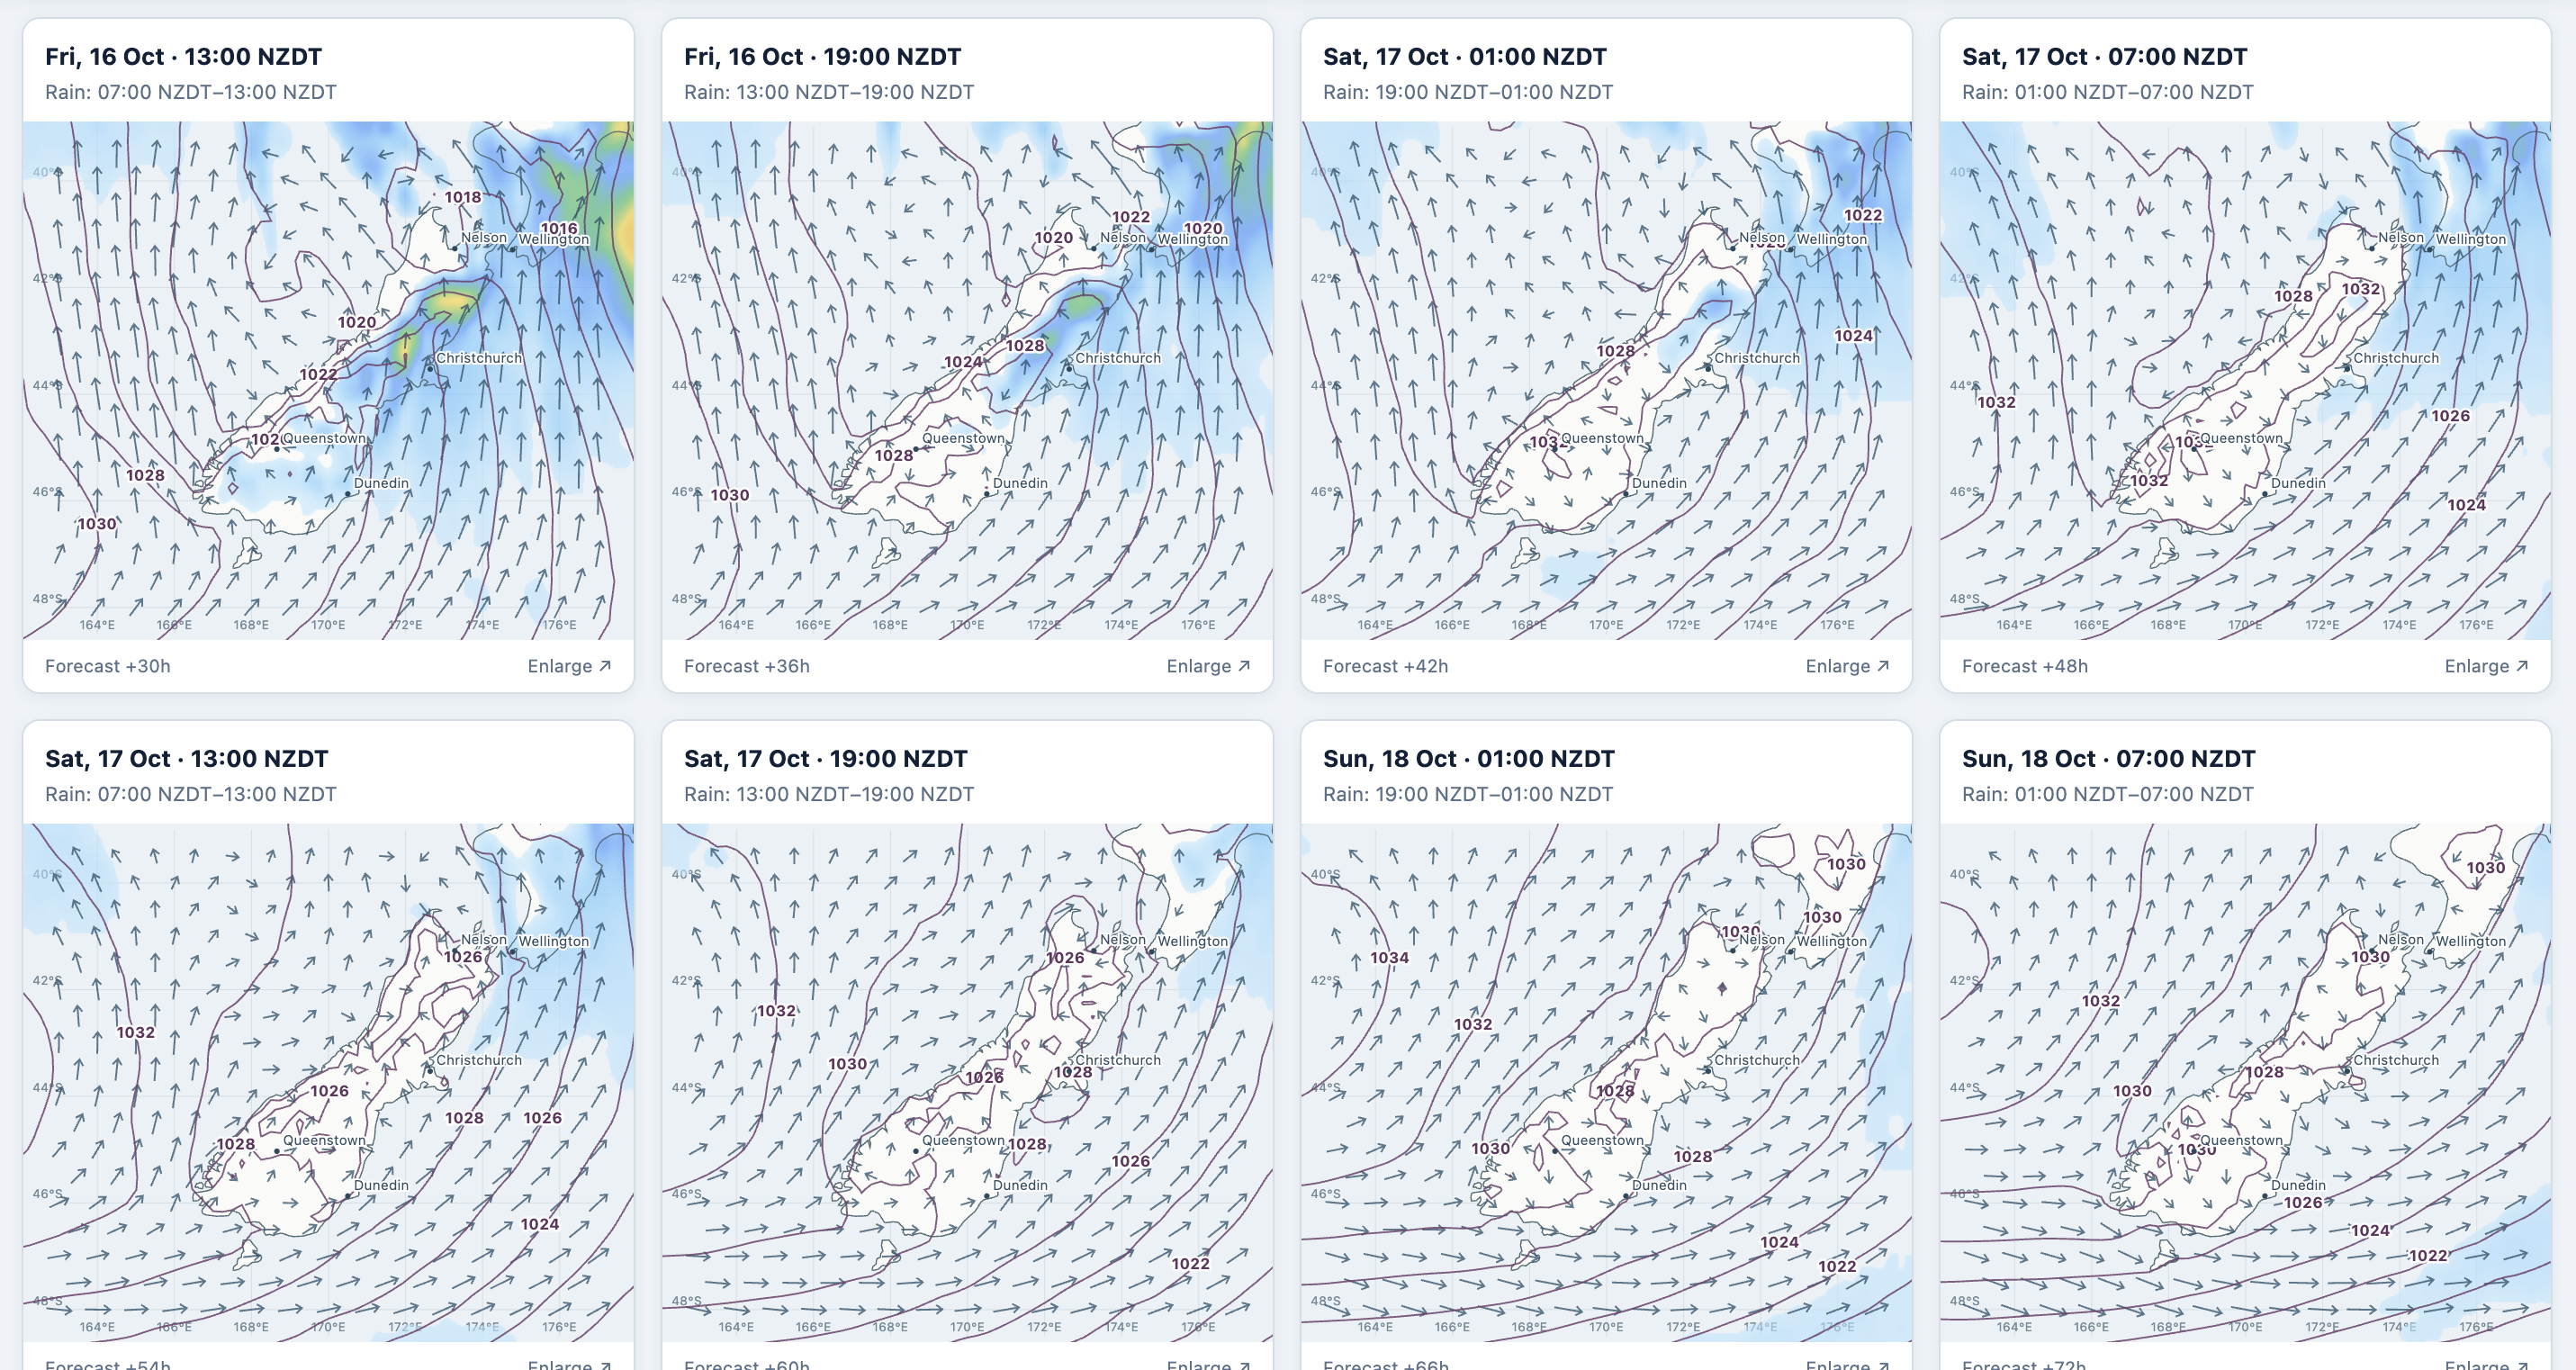 Review the charts · No rain in the forecast and an approaching high pressure system.
There’s still no substitute for standing at the river and having a look. The aim is to narrow down the options before making the drive, with a better idea of what you might find when you get there.
When might it be back in the Ideal band?
That’s the next question we’re working on. We’re developing a recovery prediction model for subscribers, which will estimate when a river is likely to fall back to the upper edge of its Ideal flow band.
Once a gauge has peaked, the model gives a most likely recovery time and a range around it. It draws on the recorded behaviour of that gauge, then can update the prediction at 24 and 48 hours as we see how the river is actually falling.
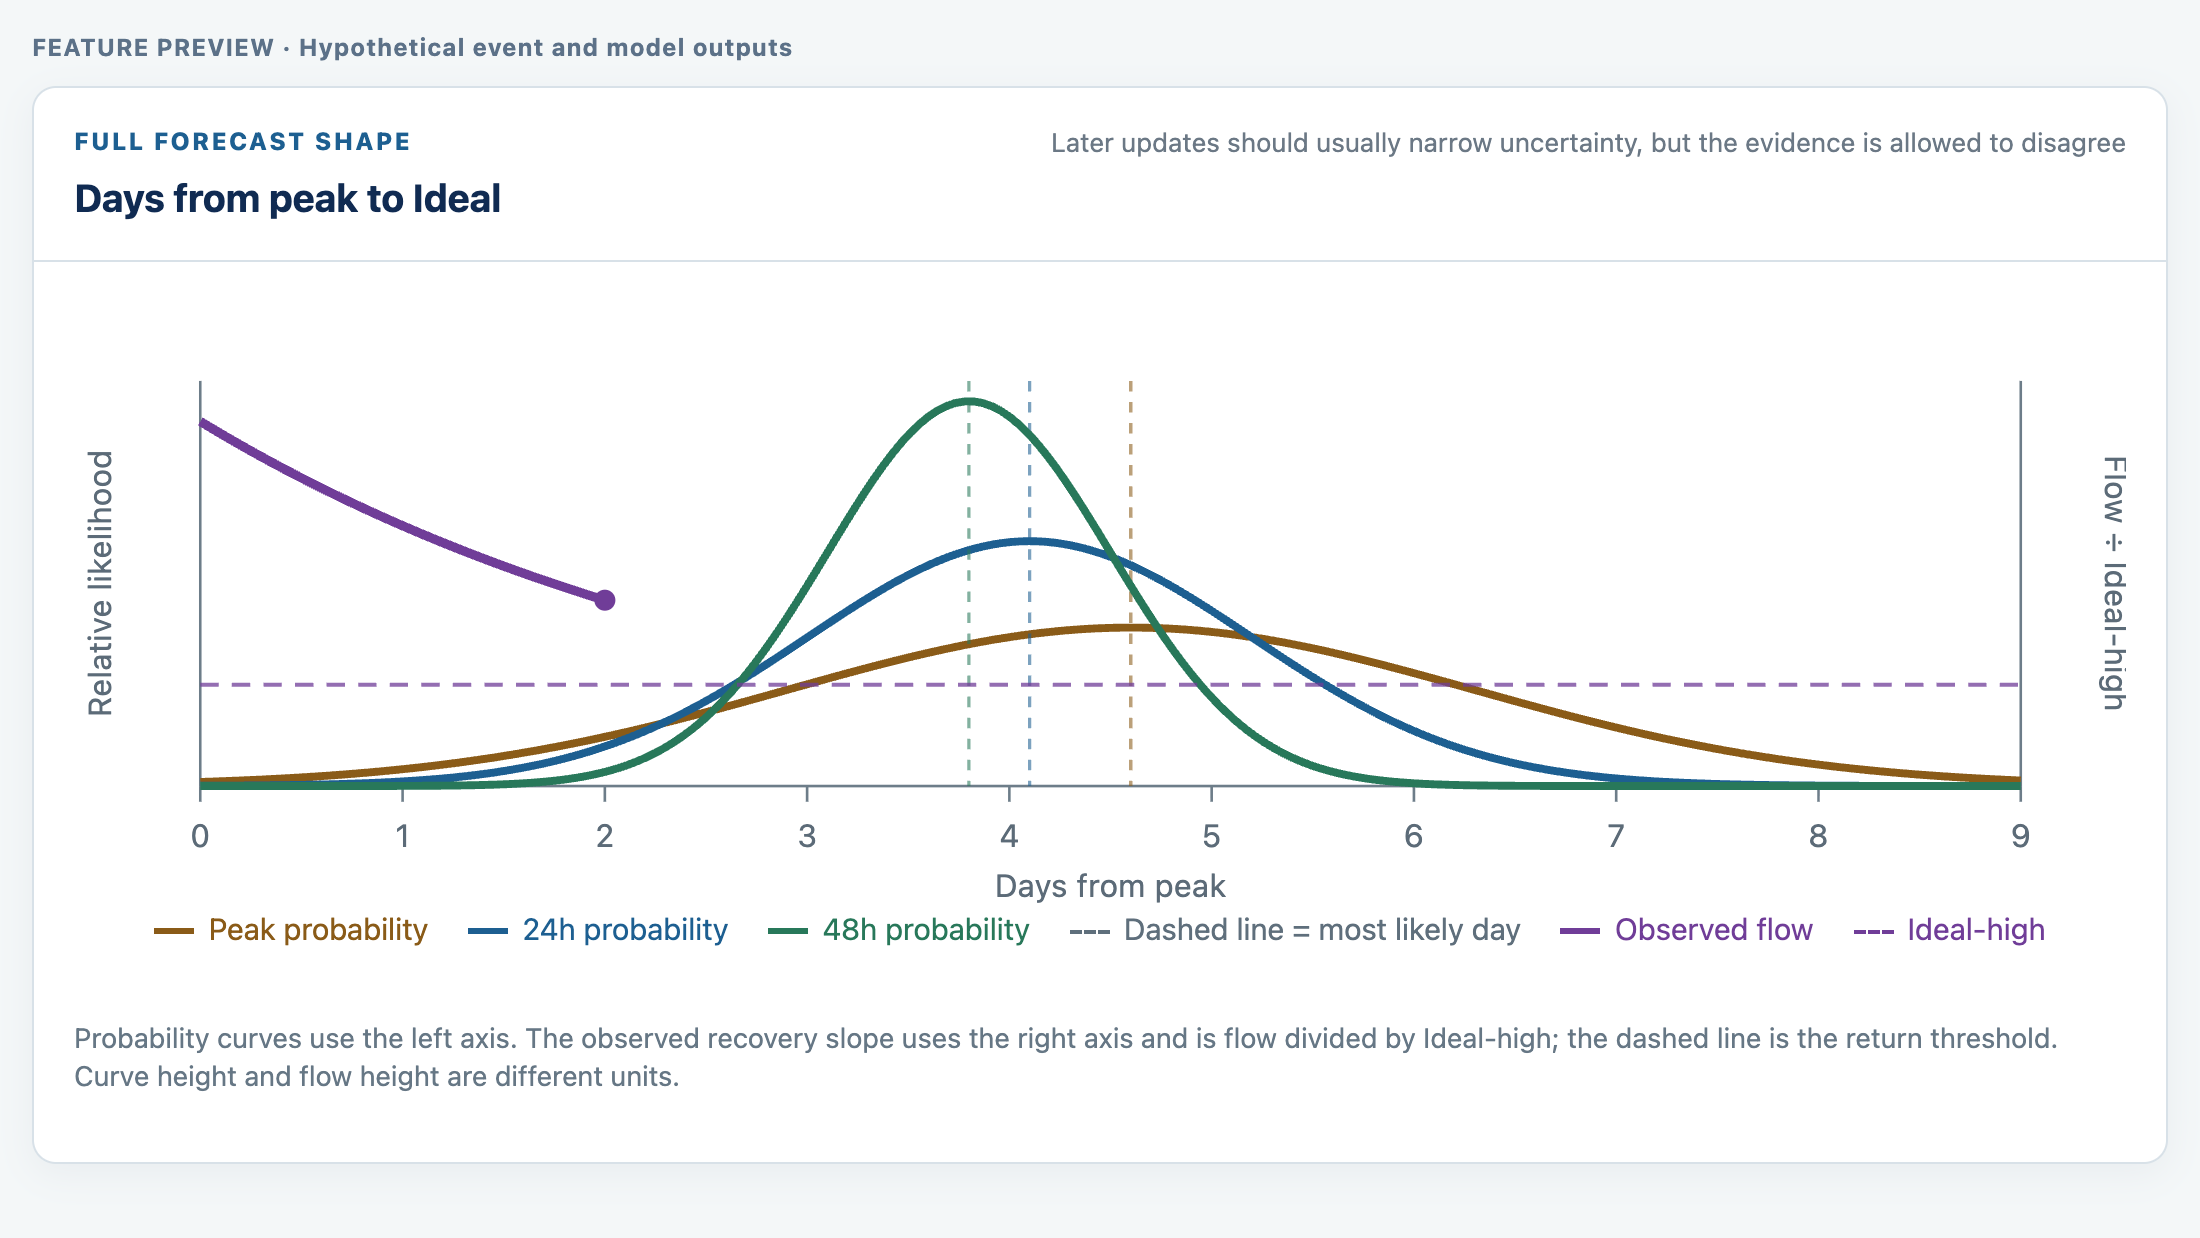 Development preview · A hypothetical event showing the predictions at the peak, 24 hours and 48 hours, alongside flow recorded during the first two days.
The brown curve is the first prediction. The blue and green curves are the updates after 24 and 48 hours. The top of each curve shows the most likely recovery time. Here, the later readings point to a slightly earlier recovery and give a narrower range.
The purple line is the flow recorded so far. It uses the scale on the right, with the dashed purple line marking the upper edge of the Ideal band. It lets us see how the river is tracking against the prediction.
The model is still experimental. The 80% probability range is its estimate of uncertainty, and we’re testing how well those ranges match completed events. Sometimes a later update will move the prediction out or widen the range. If the river starts rising materially again, the old prediction can be withdrawn.
And a return to Ideal flow still doesn’t tell us the water is clear. This is intended to help with timing our plans and our next checks, alongside what we already know about the river.
Putting it to use
Say I’m planning a few days of fishing next week, but there’s been heavy rain this week. I’ve checked the weather forecast and narrowed my options to South Canterbury or the West Coast. The weather looks reasonable, but the rivers I’m interested in are still high.
I select the two regions in Explore and compare a few of my preferred gauges. In this hypothetical example, the South Canterbury option looks likely to recover sooner. The West Coast option may need a few more days.
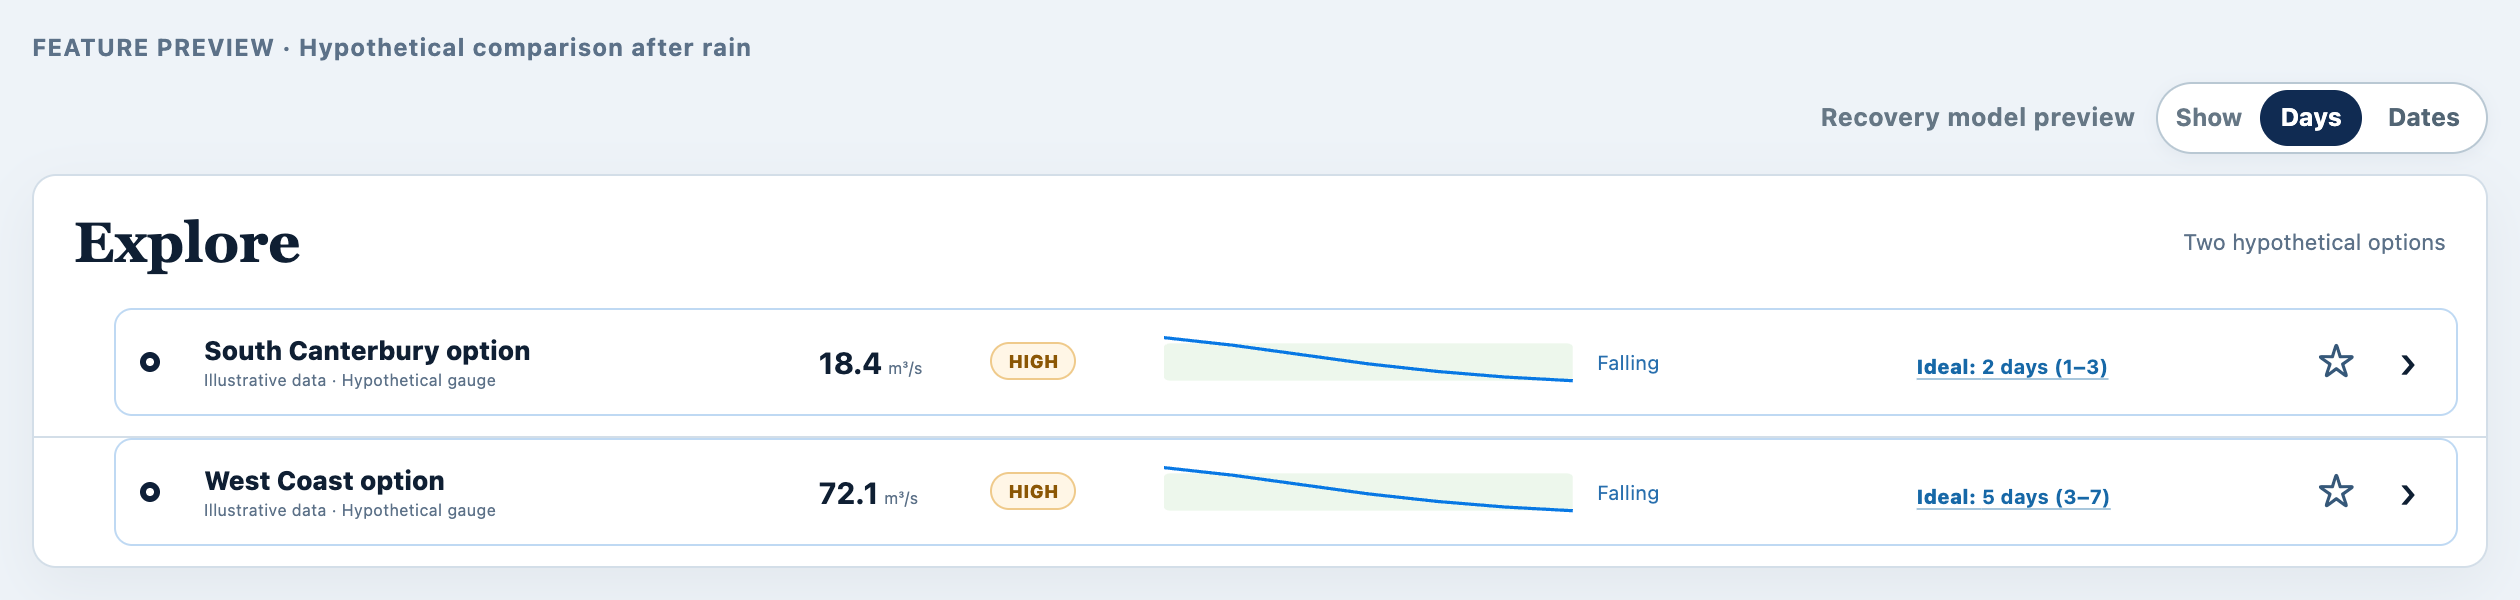 Development preview · Two hypothetical options. The recovery links show the most likely time remaining, with a wider probability range in brackets.
That gives me a reason to spend a bit more time looking at South Canterbury. I’ll open the flow histories, check the other gauges on those rivers and see whether more rain is likely to change things. I’m comparing particular rivers here, rather than assuming the whole region will recover together.
The recovery estimate can be shown in days or dates. Clicking it opens the chart and more detail, including the range around the most likely day. If I’ve got some flexibility in my plans, that range is useful: I can allow another day or keep a second river in mind.
I’ll check again before leaving. By then, another day of readings may have made the choice clearer, or the weather may have changed the plan altogether.
That’s how I’d use River Check after rain. Follow the peak, watch how the river falls, check the forecast and compare it with the other places you’d like to fish.
These River Check features won’t remove all the uncertainty, but they can help to make the most of those first opportunities as the rivers clear.
Where do I actually go? Well, some things River Check can’t reveal…